Two Things that will Make Your Data Center AI Projects Hard to Execute - Data & Culture

It was predictable that with Google sharing its use of Machine Learning in a mathematical model of a mechanical system that others would say they can do it too.  DCK has a post on Romonet and Vigilent being other companies that use AI concepts in data centers.

Google made headlines when it revealed that it is using machine learning to optimize its data center performance. But the search giant isn’t the first company to harness artificial intelligence to fine-tune its server infrastructure. In fact, Google’s effort is only the latest in a series of initiatives to create an electronic “data center brain” that can analyze IT infrastructure.

...

One company that has welcomed the attention around Google’s announcement is Romonet, the UK-based maker of data center management tools.

...

 Vigilent, which uses machine learning to provide real-time optimization of cooling within server rooms.

Google has been using Machine Learning for a long time and uses it for many other things like their Google Prediction API.

What is the Google Prediction API?

Google's cloud-based machine learning tools can help analyze your data to add the following features to your applications:

Customer sentiment analysis

Spam detection
Message routing decisions

Upsell opportunity analysis
Document and email classification

Diagnostics
Churn analysis

Suspicious activity identification
Recommendation systems

And much more...

Here is a Youtube video from 2011 where Google is telling developers how to use this API.

Learn how to recommend the unexpected, automate the repetitive, and distill the essential using machine learning. This session will show you how you can easily add smarts to your apps with the Prediction API, and how to create apps that rapidly adapt to new data.

So you are all pumped up to get AI in your data center.  But, here are two things you need to be aware of that can make your projects harder to execute.

First the quality of your data.  Everyone has heard garbage in - garbage out.  But when you create machine learning systems the accuracy of data can be critical.  Google’s Jim Gao, their data center “boy genius” discusses one example.

 Catching Erroneous Meter Readings

In Q2 2011,Google announced that it would include natural gas as part of ongoing efforts to calculate PUE in a holistic and transparent manner [9]. This required installing automated natural gas meters at each of Google’s DCs. However, local variations in the type of gas meter used caused confusion regarding erroneous measurement units. For example, some meters reported 1 pulse per 1000 scf of natural gas, whereas others reported a 1:1 or 1:100 ratio. The local DC operations teams detected the anomalies when the realtime, actual PUE values exceeded the predicted PUE values by 0.02 - 0.1 during periods of natural gas usage.

Going through all your data inputs to make sure the data is clean is painful.  Google used 70% of its data to train the model and 30% to validate the model.  Are you that disciplined?  Do you have a mechanical engineer on staff who can review the accuracy of your mathematical model?

Second, the culture in your company is an intangible to many.  But, if you have been around enough data center operations staff, their habits and methods are not intangible.  They are real and what makes so many things happen.  Going back to Google’s Jim Gao.  He had a wealth of subject matter expertise on machine learning and other AI methods in Google.  He had help deploying the models from Google staff.  And he had the support of the VP of data centers and the local data center operations teams.

 I would like to thank Tal Shaked for his insights on neural network design and implementation. Alejandro

Lameda Lopez and Winnie Lam have been instrumental in model deployment on live Google data centers.

Finally, this project would not have been possible without the advice and technical support from Joe Kava,

as well as the local data center operations teams.

Think about these issues of data quality and the culture in your data center before you attempt an AI project.  If you dig into automation projects it is rarely as easy as when people thought it would be.

Back to Blogging

I had an unintended break from Blogging.  I got a chance to attend an analyst briefing by RMS and got to meet in person Hemant Shah the CEO.  Why is RMS interesting to me?  Because here is a company that has spent 25 years working on catastrophe risk modeling and they are about to launch on Apr 15 their Cloud HPC Risk Modeling environment, RMS One.

I had just listened to Hemant’s talk at Stanford.

Description 

Hemant Shah, co-founder and CEO of RMS, takes students on a ride through the highs and lows of growing and changing a company. From early days in an apartment with co-founders, to making the tough calls as a market leader in risk and catastrophe modeling, Shah discusses lessons around culture, business models, and pivoting a value proposition.

Spending the day with RMS got me thinking of how to view operations from a Risk perspective.  This perspective was not what they told us, but I saw how risk is different way to view the waste that can exist.

I had so many ideas spinning in my head I was having a hard time writing down the ideas, but that is not a good excuse.

Anyway back to writing.  This is a busy week.  OSIsoft has their user conference that I haven’t attended for over 5 years.  Google has their cloud event in SF.  and AWS has their one day summit SF as well.  Going to a data center in Santa Clara.  And, going to try some ideas on how risk modeling is a perspective to see the issues that exist in operations.

Tip for IT to control the cloud, don't control it, get data

I was on a webinar yesterday to discuss the best route to the cloud.  One of the last questions was 

NewImage

The day before I had a conversation with Luke Kanies, CEO of Puppetlabs to catch up.  I was introduced by a mutual friend a couple of years ago, and we have had always had great discussions.

I told Luke I was participating in a webinar on the cloud and it would seem like a tool like Puppet Enterprise could be used to get the data on what clouds are being built and deployed.

Puppet Enterprise is IT automation software that gives system administrators the power to easily automate repetitive tasks, quickly deploy critical applications, and proactively manage infrastructure changes, on-premise or in the cloud. Learn more about Puppet Enterprise below, or download now and manage up to 10 nodes free.

Download Free

Puppet Enterprise automates tasks at any stage of the IT infrastructure lifecycle, including:

  • Provisioning
  • Discovery
  • OS & App Configuration Management
  • Build & Release Management
  • Patch Management
  • Infrastructure Audit & Compliance

I didn't specifically mention Puppetlabs, but I made the point that the biggest step taken to take control of the cloud is to get data. Data from the deployment tools.  If central IT bought a tool that helped all the users, then they could get the data.

If Puppet Enterprise logs were sent to a central IT function they would have the data to determine what the users are doing in the cloud.  With the data you can determine how best to serve the needs.

This recommendation flies in the face of what I think of what 80% of the people would do which is to just take control.  This makes sense as these same 80% of the people would have no idea what a puppet enterprise log means.

I constantly tell people the misperception of corporate IT is it is technical organization.  No, IT is not necessarily technical.  Take a look around how many of these people are CS degrees, let alone MS or PhD.  What is technical?  Google, Apple, Facebook, Microsoft product development teams are technical.  PuppetLabs is also technical, and they have a good method to manage the IT infrastructure.

How Puppet Works

Puppet uses a declarative, model-based approach to IT automation.

  1. Define the desired state of the infrastructure’s configuration using Puppet’s declarative configuration language.
  2. Simulate configuration changes before enforcing them.
  3. Enforce the deployed desired state automatically, correcting any configuration drift.
  4. Report on the differences between actual and desired states and any changes made enforcing the desired state.

Which reminds me one of the things I enjoy talking to Luke and why another Portland friend introduced us is we both like the use of Models.

Enforce Desired State

After you deploy your configuration modules, the Puppet Agent on each node communicates regularly with the Puppet Master server to automatically enforce the desired states of the nodes.

  1. The Puppet Agent on the node sends Facts, or data about its state, to the Puppet Master server.
  2. Using the Facts, the Puppet Master server compiles a Catalog, or detailed data about how the node should be configured, and sends this back to the Puppet Agent.
  3. After making any changes to return to the desired state (or, in “no-op mode,” simply simulating these changes), the Puppet Agent sends a complete Report back to the Puppet Master.
  4. The Reports are fully accessible via open APIs for integration with other IT systems.

Uh, BTW, this is the way I think a data center should work as well. 

Data Center Energy Simulation, Fujitsu's Tool coming soon, an alternative to Romonet

At Fujitsu's North America Tech Forum the green data center topic came up in many presentations.  And, there was a tech booth with Data Center Energy Efficiency through Simulation.  The ideas was announced in 2009.

Fujitsu Advances Green Data Centre Strategy with Total CO2 and Value Analysis Solution

Fujitsu Laboratories of Europe unveils its latest Green Data Centre development at the European Technology Forum


London, 16th Sep 2009 — Fujitsu Laboratories of Europe Limited announced today the launch of its latest Green Data Centre development at the European Technology Forum, hosted by Fujitsu Laboratories of Europe in London (16-17 September 2009). Fujitsu's Total CO2 and Value Analysis solution is the result of extensive research and development, in conjunction with the Carbon Trust in the UK, the company set up by the UK Government to accelerate the move to a low carbon economy.

Based on a core simulator developed through industry collaboration and with the support of the Carbon Trust to analyse energy use and carbon emissions in data centres and identify potential reductions, Fujitsu Laboratories' new technology represents a revolutionary approach. It breaks new ground in enabling a holistic analysis of energy usage within a data centre environment to be captured, quantitatively analysed and profiled, from the physical infrastructure, to the software, applications and delivered services.

Given the demonstration was done by the Fujitsu Labs Europe I was curious on how this product relates to Romonet.

NewImage

It turns out both Fujitsu and Romonet's came from the same beginnings.

The challenge with any tool from these companies though is going to market.  Romonet is software product you buy.  Fujitsu is looking at lower cost business models that put the product on the web. Later this year Fujitsu's tool will launch.

Three Tips for a Smarter City project, IBM's Justin Cook shares insights working on Portland modeling project

I got a chance to talk to IBM's Justin Cook, Program Director, System Dynamics for Smarter Cities about IBM's press release for the Smarter Cities Portland project. 

IBM and City of Portland Collaborate to Build a Smarter City

Portland, Oregon, USA - 09 Aug 2011: To better understand the dynamic behavior of cities, the City of Portland and IBM (NYSE: IBM) have collaborated to develop an interactive model of the relationships that exist among the city's core systems, including the economy, housing, education, public safety, transportation, healthcare/wellness, government services and utilities. The resulting computer simulation allowed Portland's leaders to see how city systems work together, and in turn identify opportunities to become a smarter city. The model was built to support the development of metrics for the Portland Plan, the City's roadmap for the next 25 years.

I've got friends in Portland, so I appreciate the unique environment Portland has.  Here is what IBM discusses as when and why Portland was chose for the Smarter City project.

IBM approached the City of Portland in late 2009, attracted by the City's reputation for pioneering efforts in long-range urban planning. To kick off the project, in April of 2010 IBM facilitated sessions with over 75 Portland-area subject matter experts in a wide variety of fields to learn about system interconnection points in Portland. Later, with help from researchers at Portland State University and systems software company Forio Business Simulations, the City and IBM collected approximately 10 years of historical data from across the city to support the model. The year-long project resulted in a computer model of Portland as an interconnected system that provides planners at the Portland Bureau of Planning and Sustainability with an interactive visual model that allows them to navigate and test changes in the City's systems.

In talking to Justin, I asked him what Tips he had for implementing this complex project.  Here are three tips Justin shared with me.

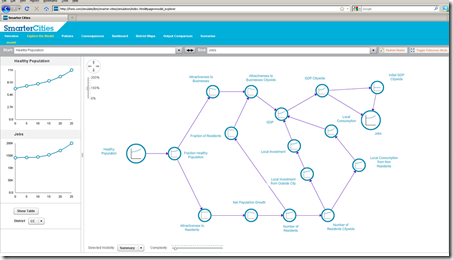
  1. Discuss the relationships of the groups to understand their perspectives and views.  This data will help you understand the semantics of information that helps you build a model.   There were 75 subject matter experts and multiple organizations involved in discussing initiatives for Portland's Plan.  Below is a view of one dashboard showing various metrics that get you thinking beyond an individual department's view.image
  2. Assumptions are openly documented to let others know inputs into the models.  Below is an example of bike lanes.image
  3. Trade-off between transparency and complexity where a simpler approach is easier to understand, therefore appears more transparent.  Justin shared that IBM's system dynamics team had 7,000 questions identified in a smarter city modeling project.

IBM is working with other cities to apply the lessons learned in Portland.

This collaboration with the City of Portland has also proven valuable for IBM.  IBM is applying its experience and modeling capabilities developed in this collaboration with the City of Portland to create offerings that will help other cities leverage systems dynamics modeling capabilities to enhance their city strategic planning efforts. Based upon IBM's experience in working with and conducting assessments of cities around the world, they've found that strategic planning in many cities is still being done in stovepipes without a holistic view of impacts/consequences across systems. By leveraging systems dynamics modeling techniques, IBM will be able to help other cities plan "smarter".

In closing Justin and I discussed the potential for projects that affect multiple city metrics and multiple city organizations to see in the model how ideas like more walking & biking lanes can address obesity, getting people out of cars which then reduces the carbon footprint of the city.  Bet you didn't think that addressing obesity could fit in a carbon reduction strategy.  IBM and Portland see the relationships in this and many other areas.

How valuable is the IBM Smarter City model?  We'll see some of the first results from Portland.